Do the United Nations have an impact in conflicts resolution?
The data story
Introduction
The United Nations often gets criticised for all the wars it could not prevent and its impact in our society has often been questioned. The UN exist since 1945, although until today the amount of conflicts around the world has not significantly diminished, does this mean that the UN is inefficient ? The Israelo-Palestinian conflict is allmost as old as the UN and no Peace Agreements (PA) could completely stop it as of today, so does the efforts made through the UN organization are worth the results ? Such a question would request more than a statistical study to be answered. Hence, we will focus on studying the impact of the UN in the domain of conflict resolution.
Our study aims at giving an objective analysis of the impact of UN peace agreements on the evolution of conflicts around the world. We present the results of our analysis as a data story. Information relative to both conflicts and peace treaties are displayed on a world map in order to get an insight on the impact they have on one another.
To perform this, we used the UCDP dataset which provides information about the conflicts from 1945 to 2016 and peace agreements from 1975 to 2011.
Conflicts
When did these conflicts happen?
When we observe the graph that displays the number of conflicts per year, we observe several peaks. The peaks are in 1946 (this corresponds to the first Indochina war), 1948 (which corresponds to the first Arab-Israeli war and the conflict for the independence of Burma). The last peak we notice is in 2015 and it corresponds to the beginning of several conflicts involving IS.
When looking at the number of conflicts that benefited from at least one peace agreement, we notice that most of them began between the 1960s and the 1990s.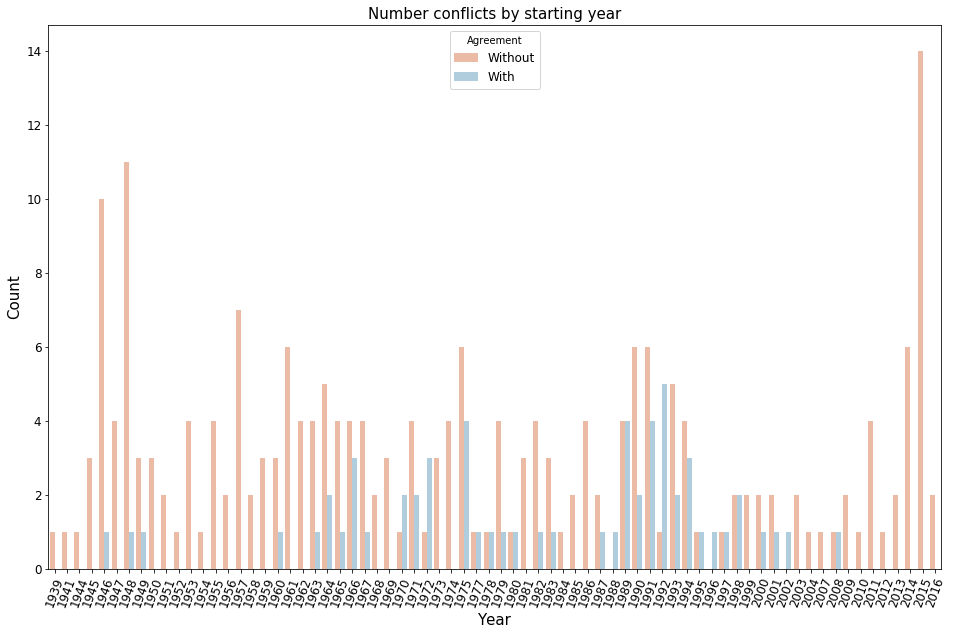
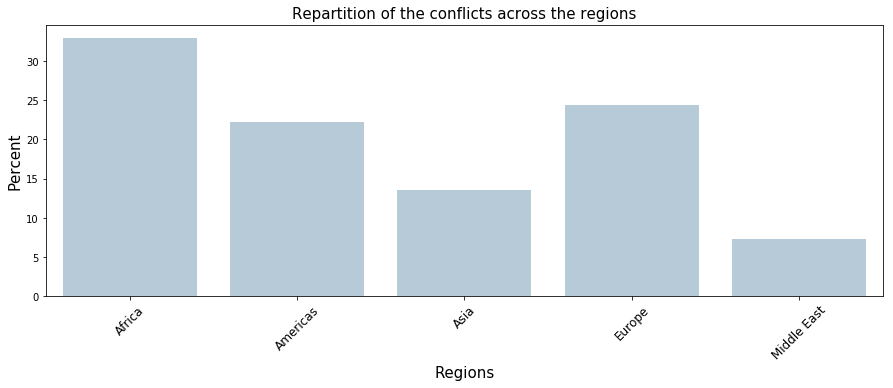
More than 30% of the conflicts took place in Africa
We divided the world in 5 region, and included the Oceania continent in the Asia region. When analysing the distribution, we observe that more than 50% of the conflicts happened in Africa or in Europe.
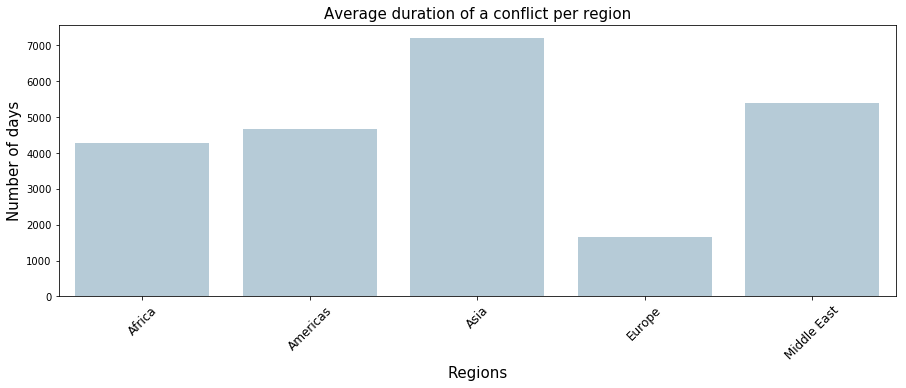
Another interesting fact is that less than 10% of the conflicts were situated in the Middle East, although it is known to be a region with a lot of tensions.On average, a conflict lasts more than 19 years in Asia
The average duration of a conflict is very different across the regions. Indeed, the average duration of a conflict in Europe is of 1500 days whereas a conflict in Asia has an average duration of 7000 days. Observe that the conflicts in the Middle East have an average duration that is high as well. Even though the region has a small amount of conflicts, they are last for a long time on average.
Are the conflicts that did or did not benefit from a peace agreement equally distributed?
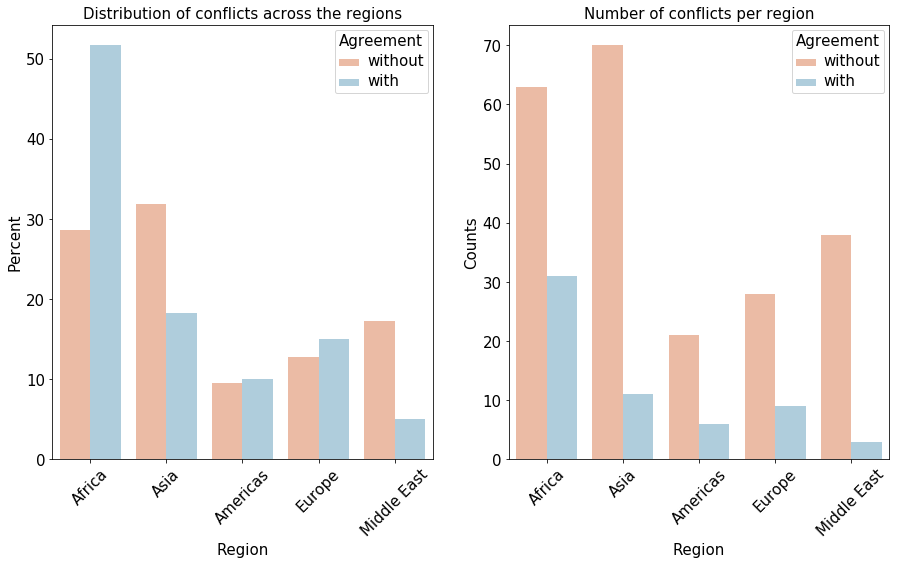
More than 50% of the conflicts that benefited from a peace agreement were located in Africa
From now we will observe how the conflicts that did or did not have a peace agreement were distributed according to several features. We begin with the distribution across the regions.
We observe that the distributions are not the same across the regions. A large proportion of conflicts that took part in Europe or in Africa benefited from one or several peace agreements whereas there is almost no peace agreements in the Middle East or in Asia. Indeed, looking at the distribution, more than 50% of the conflicts that benefited from at least one peace agreement are located in Africa whereas 30% of the conflicts that did not benefit from a peace agreement took place in Africa. Furthermore, we notice that 33% of african conflicts received a peace agreement, 25% in Europe, but only 7% in the Middle East.A large majority of the solved conflicts are internal
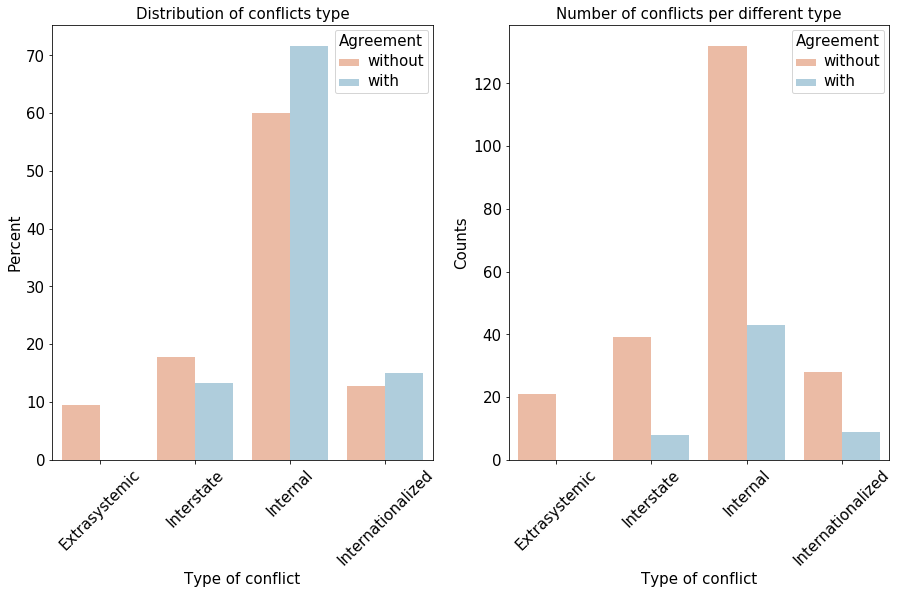
There is three different types of conflict.
- Extrasystemic conflicts correspond to colonial or imperial conflicts.
- Interstate armed conflict occurs between two or more states.
- Internal armed conflict occurs between the government of a state and one or more internal opposition group(s) without intervention from other states.
- Internationalized internal armed conflict occurs between the government of a state and one or more internal opposition group(s) with intervention from other states on one or both sides.
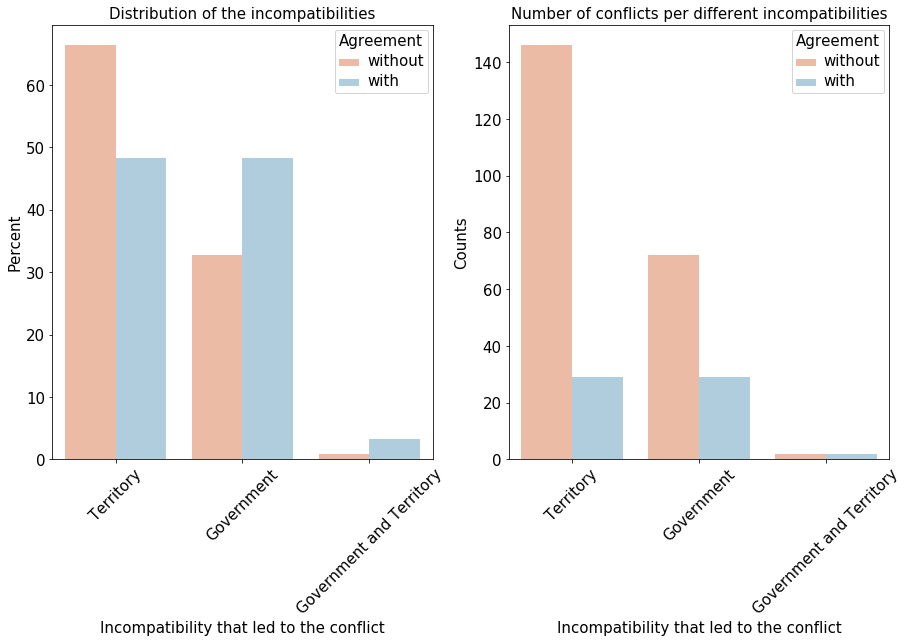
The distributions are different across the incompatibilities that led to the conflicts
Three different types of incompatibility can lead to a conflict. Territorial incompatibilities, governmental incompatibilities, or both.
There are very few conflicts that began because of the two incompatibilities. The distribution of the conflicts that did not benefit from a peace agreement is strongly centred around territorial incompatibilities whereas the one for the conflicts that benifited from an agreement is even between Territorial and Governmental incompatibilities.More than 60% of the conflicts that benefited from a peace agreements totalized more than 1000 casualties
The last feature we will explore divides the conflicts into two different classes. Conflicts totalizing more than 1000 deaths for their entire duration and the ones totalizing 1000 deaths or less.
Peace agreements focus more on deadly conflicts than the least mortal ones. The distribution for the conflicts that did not benefit from a peace agreement is even between the two classes, deadly or less deadly.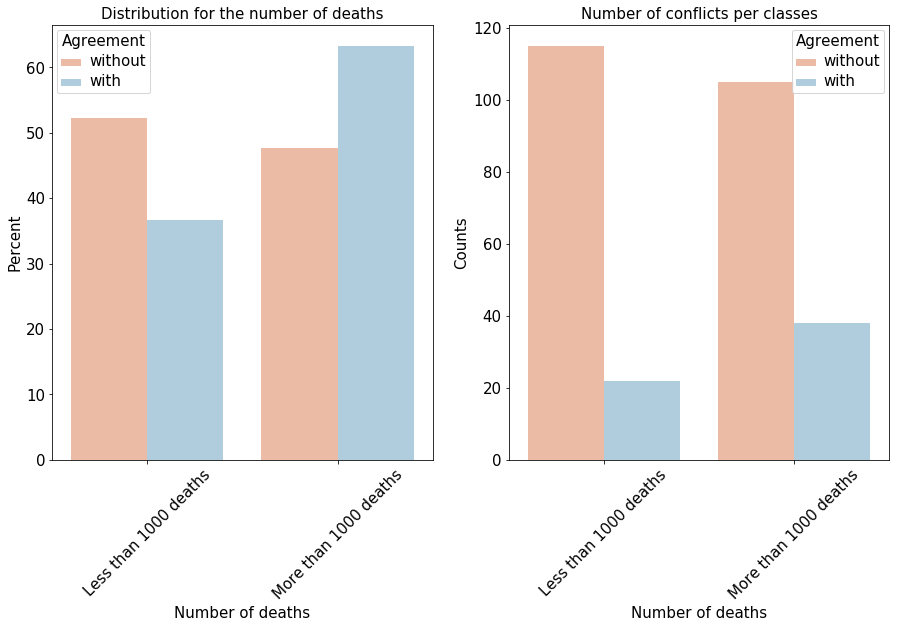
Are the conflicts solved by the UN different?
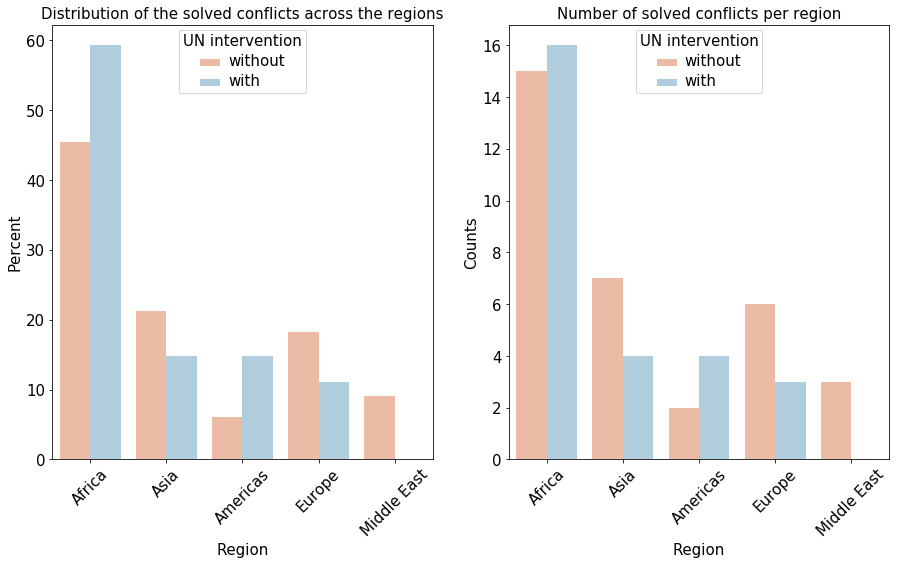
The UN is more focused on Africa compared to the other actors
For this part, we filter the conflicts in order to only vizualize those who benefited from a peace agreements.
The distributions are not the same depending on the region. The distribution for the conflicts solved by the UN is more centered on Africa and Americas compared to conflicts that were solved by other entities. Note that according to our database, the UN did not take part in any peace agreement for a conflict in the Middle East.The UN is more focused on the internationalized conflicts
We notice a bit of a difference between the distributions. Indeed, when we look at the conflicts solved by the UN, Internationalized conflicts represents 20% of them whereas it represents less than 10% for the conflicts that received a Peace Agreement from another entity.
The UN seem to be more focused on Internationalized conflicts than Interstate conflicts compared to the control group distribution.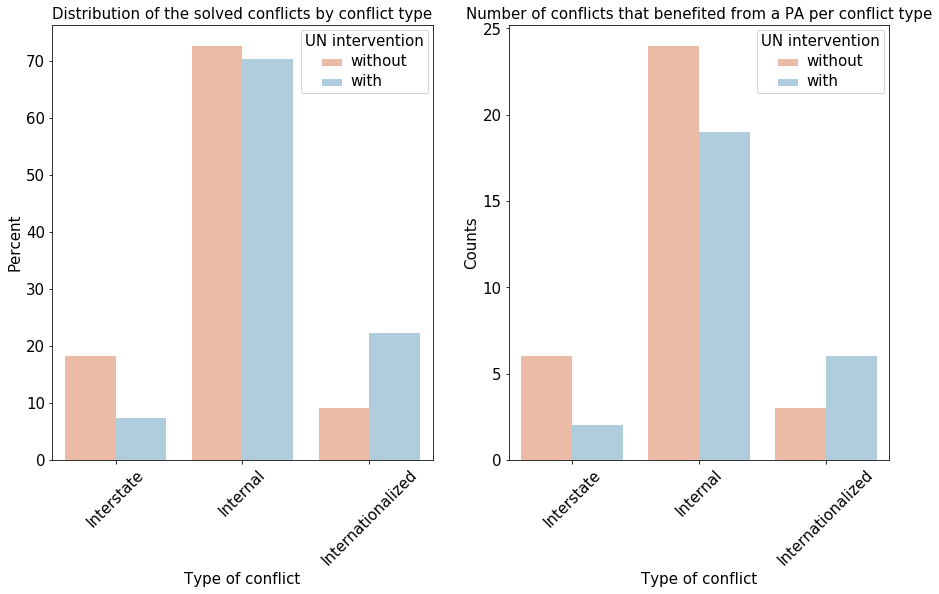
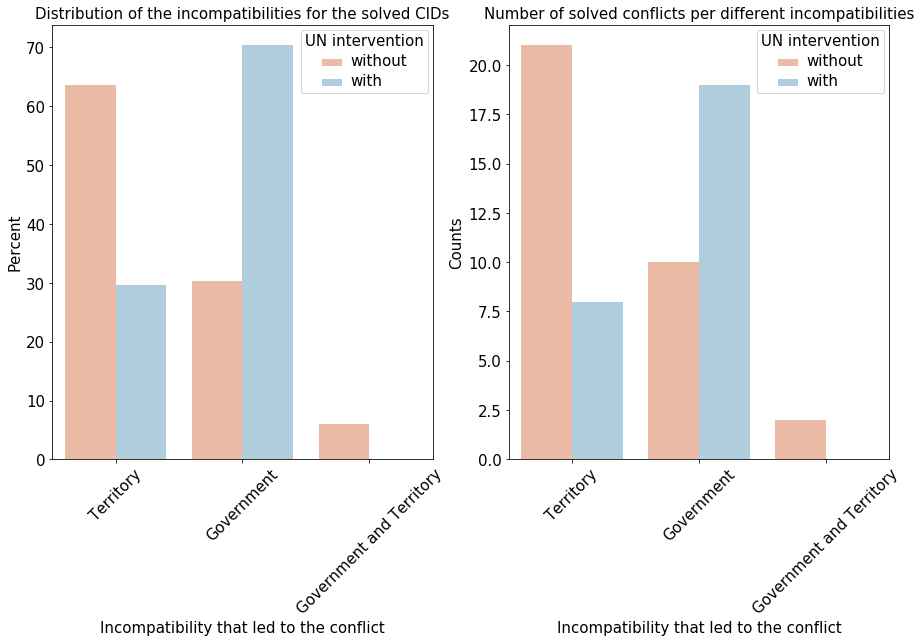
70% of the conflicts solved by the UN started because of a governmental incompatibility
These distributions are very different. Indeed, the distribution for the UN is centered around government incompatibility (more than 70% of the conflicts solved by the UN) whereas the conflicts that were not solved by the UN are more centered around conflicts that began because of a Territorial incompatibility.
When doing the observational study on the effectiveness of the UN peace agreements later, we will have to remember that the conflicts that the UN solved are different from the ones solved by other actors.The UN is solving a bigger part of deadly conflicts
The UN is way more focused on deadly conflicts as 80% of the conflicts solved by the UN have more than 1000 deaths. The distribution is different for the other type of peace agreements as they solve both types of conflicts equally.
After analyzing all these distributions, we observe that the UN is more involved in peace agreements for deadly, internationalized conflicts than the other third party actors. These types of conflicts are known to be more difficult to solve so we will have to take this into account during our observational study: are the UN peace agreements more effective than the peace agreements proposed by other actors? After exploring some facts about the conflicts present in our database, we will explore the peace agreements in the next part.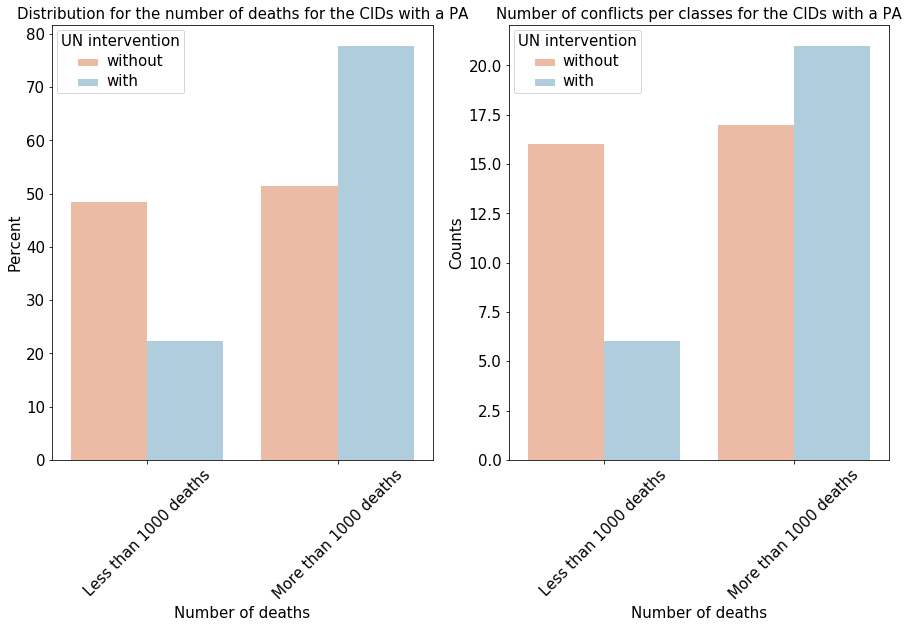
Peace Agreements
United Nations only started to get involved in Peace agreements in 1990.
1991 is the year where most peace agreements were signed. There has been two periods with a low amount of peace agreement, from 1983 to 1987 and from 2009 to 2011.
Until 1990, The UN were not taking part to Peace agreements except for the Peace Process agreement between Namibia and South Africa in 1978.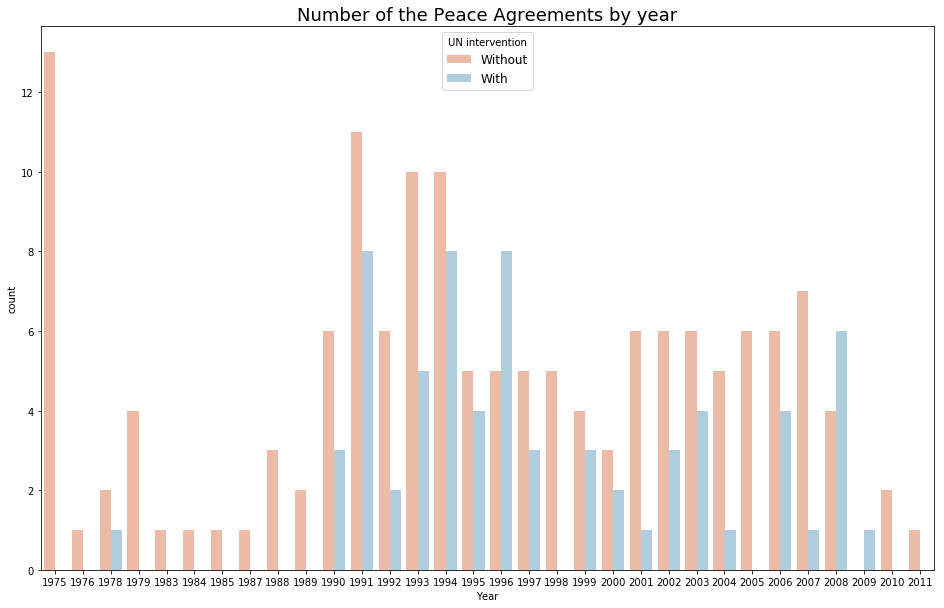
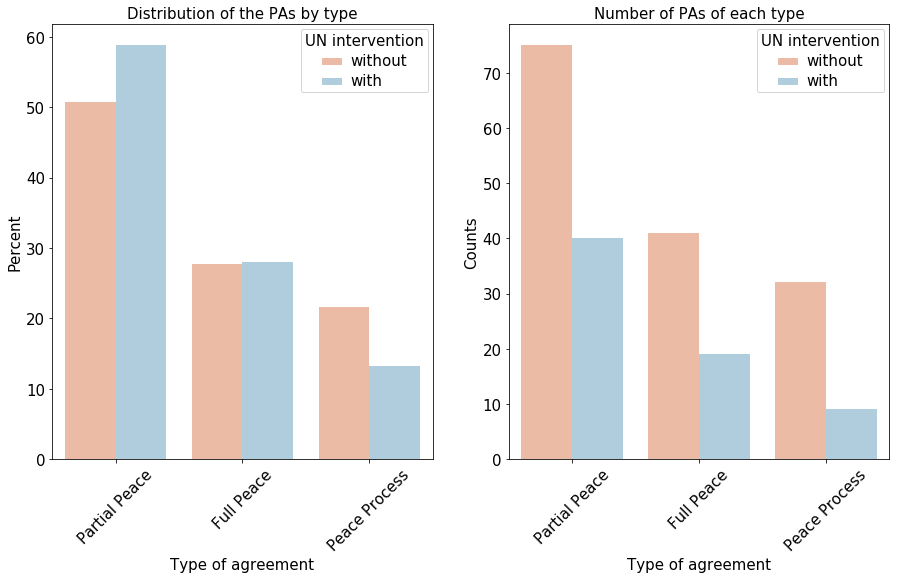
Executive strength of Peace Agreements
There are three types of agreements in terms of effectiveness :
- Full peace agreement
- Partial peace agreement
- Peace process agreement
Obviously, this goes from the most executive agreement to the least executive agreement, although it does not translate the power of a Peace Agreement. Most peace agreements are partial peace agreements.
Peace Process agreements are generally agreements that are signed at the begginning of a conflict and call for future peace agreements. The distribution of peace agreements depending on their executive power does not change much whether the UN is involved or not.Constructing peace needs time... and agreements
Approximately half of the conflicts we studied that were solved, were solved in one peace agreement. However, peace agreements cannot allways be so efficient for all conflicts. Some conflicts needed more than a dozen peace agreements to achieve peace... or not even.
The conflict between the Government of Guatemala and the Guatemalan National Revolutionary Unity (1990-1996) needed 16 peace agreements to set a durable peace in the region. These were signed in six years and all of them are still valid as of today.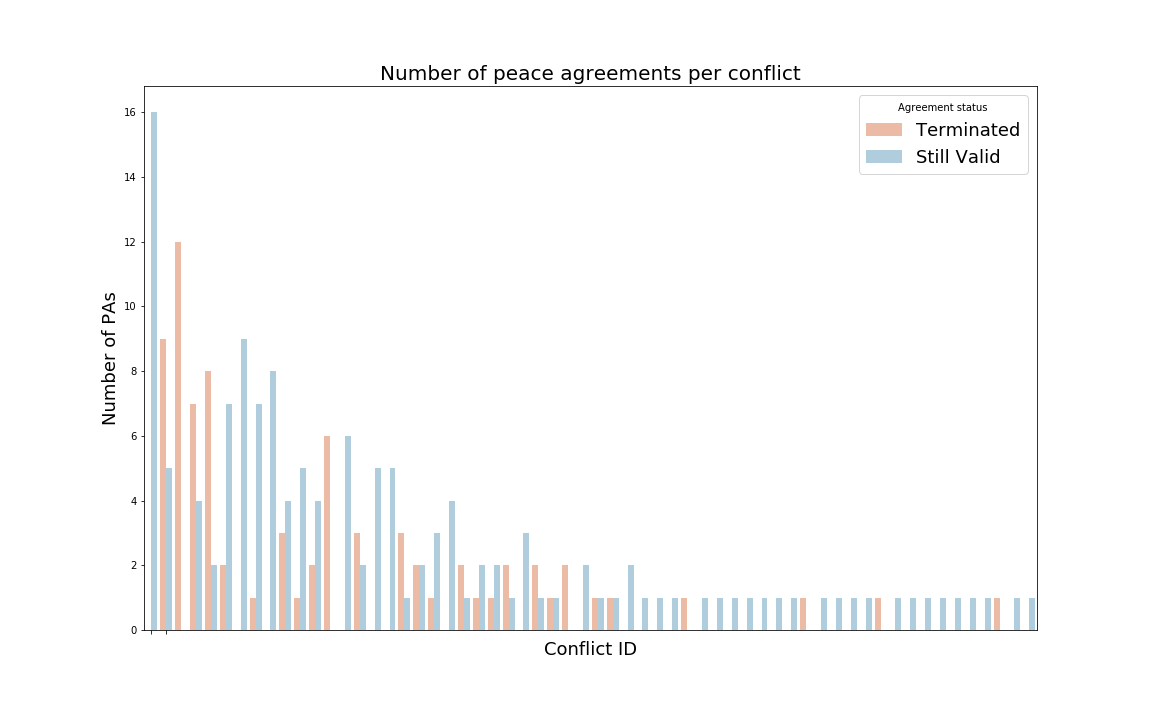
Failing Peace Agreements
The Peace Agreements treating the conflict between Iran and Iraq could never establish peace. Each of the 12 agreements were signed in 1975. Despite the first agreements, that was signed by The Shah of Iran and SADDAM HUSSEIN, all of them were signed by the same two representatives of Iran and Iraq, respectively by ABBAS-ALI KHALATBARY, Minister for Foreign Affairs of Iran and SAADOUN HAMADI, Minister for Foreign Affairs of Iraq. These agreements that were active in 1975, were then terminated between 1975 and 1980 until they were reactivated. Although the agreements were reactivated in 1980. Conflicts between Iran and Iraq did not stop in 1980, hence we can consider those agreements as complete failures.
The Republic of Rwanda and the Rwandese Patriotic Front were in conflict from 1990 to 1994 when the revolutionnaries became the ruling political party. Six agreements were signed between 1992 and 1993. The five first agreements were signed to provide partial peace and the last one in august 1993 was supposed to provide full peace to the region. None of the agreements provided for the holding of national talks to solve incompatibility and for the integration of rebels into civil service. In April 1994, a genocide broke out and the peace agreements were never fully implemented. The armed wing of the Rwandese Patriotic front ended the genocide in 1994. The agreement to solve the governmental incompatibility between Namibia and South Africa was signed in 1978 and lasted two months. The agreement contained provisions for political incompatibilities leading to independence for Namibia, justice provisions with the return of refugees and release of political prisoners and behavior regulations such as (ceasefire, withdrawal of foreign forces and demobilisation of local armies). The agreement covered indigenous rights and culture and strengthened the position of the indigenous people in Mexico. The accord was never implemented and thus further peace talks that were planned in September the same year were suspended by EZLN. No exact date for the ending of the peace accord has been found.UN involvment in peace agreements and conflicts origin.
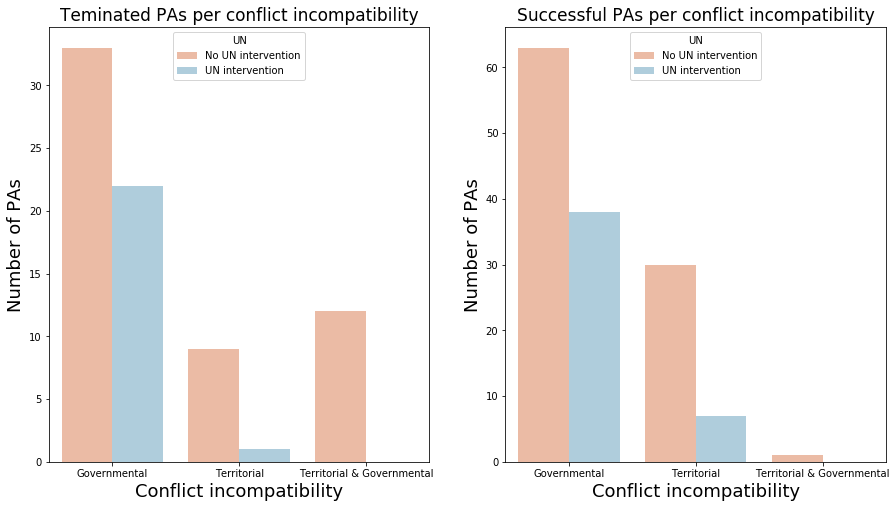
The UN is more involved in governmental conflicts than territorial ones and has a higher percentage of success than ones where it is not involved.
The UN never took part to Peace Agreements supposing to settle governmental and territorial conflicts. The governmental and territorial conflicts are the ones with the lowest success rate.| Incompatibility | Success rate |
|---|---|
| Governmental | 65% |
| Territorial | 78% |
| Governmental and territorial | 7% |
Insight on the Peace Agreements
Each peace agreement is defined by a few charateristics for each type of political provision (a provision is a clause in legal instrument). Below we give details about the most recurring clauses.
Regulation of warring parties behavior
Most peace agreements that contain behavioral clauses provide for a ceasefire and the disarmement of foreign forces. Two kinds of agreements were never terminated. The ones which provided for the creation of a new national army or the integration of rebels into the army and the withdrawal of foreign forces.
Regulation of governmental incompatibilities
72% of the peace agreements concern governmental incompabilities. Peace agreements that provide governmental provisions mostly provide for elections and electoral reforms for rebel integration into the interim government. The main difference that can be observed between UN agreements and non UN agreements is that the UN agreements usually provide provisions for an interim government and elections while non UN agreements msotly only provide provisions for an election.
Regulation of territorial incompatibilities
Territorial conflicts are mostly treated by peace agreements with clauses about the demarcation of a border or the government granting the disputed region to the other warring party.
60% of the peace agreements contain a clause concerning justice.
Peace agreement usually contain a clause to regulate justice issues, it can be the return of refugees, the release of prisoners, an Amnesty or the concept of National Reconciliation. The most recurring clause is the release of prisoners.
The UN being involved in the negociations of a peace agreement generaly increases the chances of including a justice clause.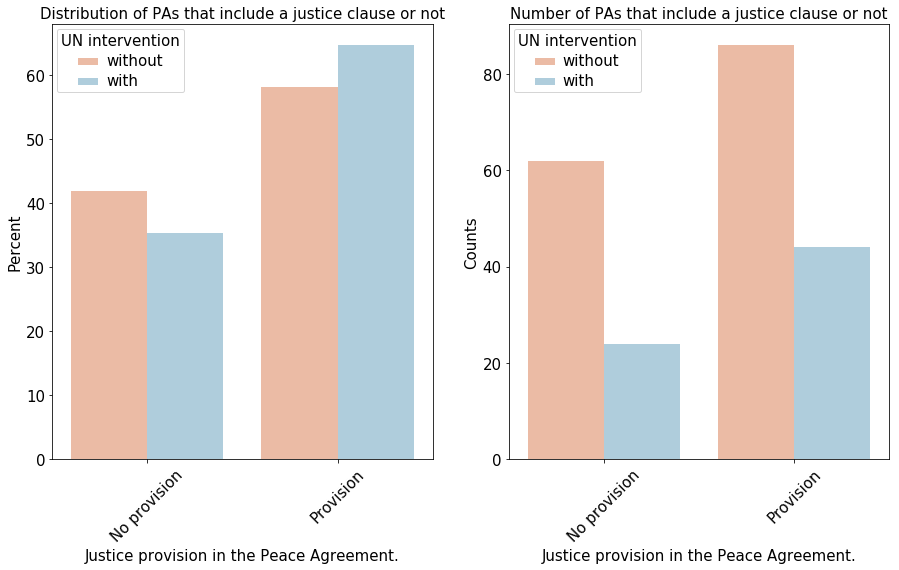
Impact of the UN
The UN is present in 31% of the agreements and took part to at least one peace agreement in 27 conflicts.
In this part, we will explore if the peace agreements where the United Nations acted as a third party performed better than the peace agreements where the UN did not act. In order to do so, we will check the proportion of peace agreements that are terminated, or broken in both cases.A naive analysis
First, let's just compute the proportions straight from our Peace Agreements database.
We observe that 34% of the agreements that included the UN were broken, this proportion goes up to 36% for the agreements that did not include the UN. This totally naive analysis can't give us a conclusion to our problematic, we can not say anything about the UN performances at this point.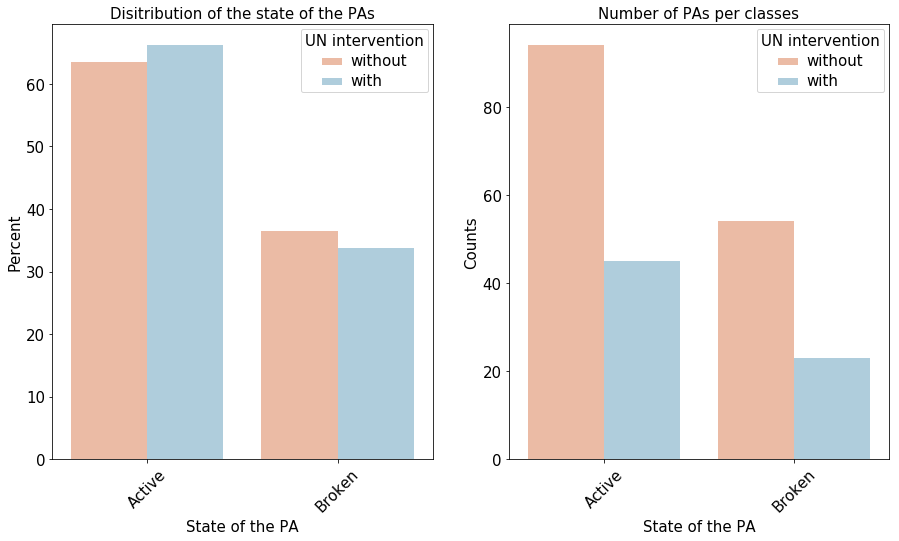
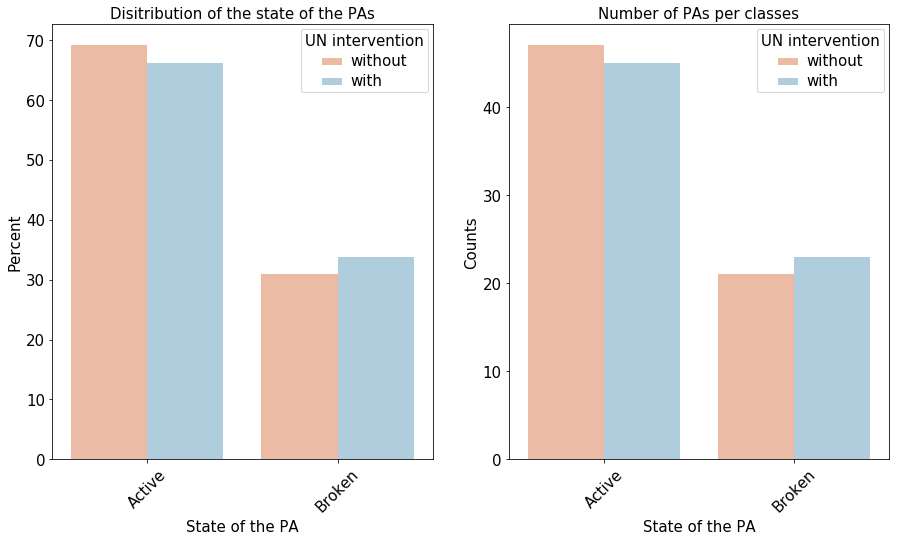
After performing a propensity score matching on the Peace Agreements (detail of the method available in the notebook)
Our previous analysis was quite naive as we saw on the earlier part about the peace agreements that they are not equally dristributed accross the two classes that are UN and not UN.
In order to solve this problem, we decided to perform a propensity score matching among the PAs, having the UN involvment as a treatment. To do so, we matched the 68 UN peace agreements using a propensity score mathing algorithm (you can check our notebook for further details). After these peace agreements are matched we have that only 30% of the agreements that did not include the UN ended. With this analysis, we could think that the UN is performing worst than the other 3rd parties. But it is important to remember that we matched the PAs according to the caracteristics of the peace agreements, not the caracteristics of the conflicts. This means our analysis is still biased as we saw in the first part of this data story that the UN solved conflicts that were more deadly than the other 3rd parties. Let's perform the matching on the conflicts as well to conclude our analysis with an even less naive analysis.When matching on the conflicts that the UN solved
We observed in the first part that the conflicts that the UN solved were more deadly and that they often started because of a governmental incompatibility. Furthermore, we studied in the peace agreement part that a governmental incompatibility conflict is way harder to solve than other conflicts. In order for the analysis to be more fair, we will match the peace agreements so that they are only on the same conflicts as the ones the UN solved. This results in 68 peace agreements for each parts.
When matching on the conflicts , we observe that 42% of the conflicts solved by another 3rd party than the UN failed. This is way higher than the fail rate of the UN that is of 33%. When matching on the conflicts, we observe that the UN peace agreements are way more stable than the ones performed by other 3rd parties. Indeed, we observed in the previous parts that the UN was taking care of a larger part of deadly governmental conflicts compared to the other 3rd parties. A naive analysis first showed us that the UN was performing as good as other 3rd parties if not worst, but when pushing this observational study further we showed that it is bringing more stability when it is involved in the resolution of a conflict.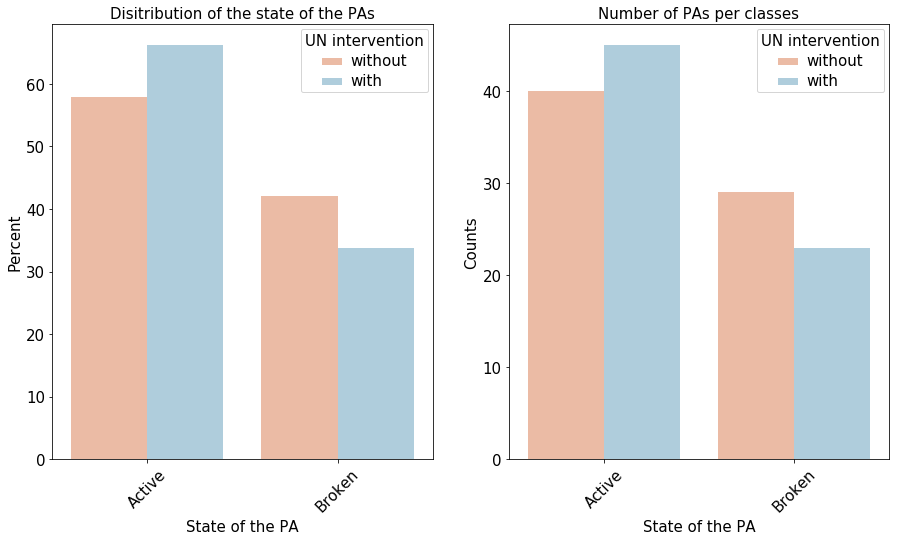
Conclusion
Our study showed that after matching on the peace agreements and on the conflicts, the UN seems to perform better than other third party actors. Indeed, only 33% of the UN Peace agreements were broken while this number goes up to 42% for other actors.
However, it is important to note that performing a Fisher exact test on these proportions outputed a p-value of 0.37 which means that we cannot reject the null hypothesis that the UN and other parties are equally likely to have their peace agreement broken. If you are interested in these technical p-values analysis, you can have a look at our notebook. In the domain of conflict resolution, our study showed that the UN have an impact although the relatively high p-value we obtained in the Fisher test cannot prove this impact 'scientifically'. It should be noted that UN biggest challenges does not land in the resolution of existing conflicts but rather in the settlement of communication channels to avoid the creation of tensions between countries. For further research, An analysis of the interactions between state leaders and the tension level between countries could be made.